


Biocon is available at very attractive valuations. Should we buy Biocon now? What is the future of Biocon ? Let us find out
Buy Range – Rs. 200-240,
Target- Rs. 489
Biocon Share Price Today

| Year | Share price (Base Case) | Share Price (Bear Case) | Share Price (Bull Case) |
| 2022 | 368 | 245 | 491 |
| 2023 | 420 | 280 | 560 |
| 2024 | 478 | 319 | 638 |
| 2025 | 545 | 364 | 727 |
| 2026 | 622 | 415 | 829 |
| 2027 | 709 | 473 | 945 |
| 2028 | 808 | 539 | 1078 |
| 2029 | 921 | 614 | 1228 |
| 2030 | 1050 | 700 | 1400 |
Biocon Ltd., a leading firm in biotechnology is available at very cheap valuations. It is posting the highest-ever results and touching a 52-week low. Long-term investment in this mid-cap stock can produce multi-bagger returns for its investors.
Biocon Ltd.-Business Model
Biocon Ltd. is involved in the manufacturing of biotechnology products and research services.
It has grown biosimilars for insulin used in the treatment of diabetes. It is also involved in the manufacturing of antibodies for the treatment of Head and Neck cancer.
Biocon Ltd. recently acquired Viatris Global Biosimilar Business.
Biocon Biologics, one of its subsidiaries has emerged as a world-leading biosimilar player with 8 commercialized products.
Its business includes Research and development, filing for approval of the product, and then the manufacturing of the product.
Biocon Limited deals with medicines for rare diseases which have to be used regularly but by a minimal population.
Syngene Ltd. and Biocon Biologics are its subsidiaries.
Biocon Ltd. – Fundamental Analysis
Quarterly Results
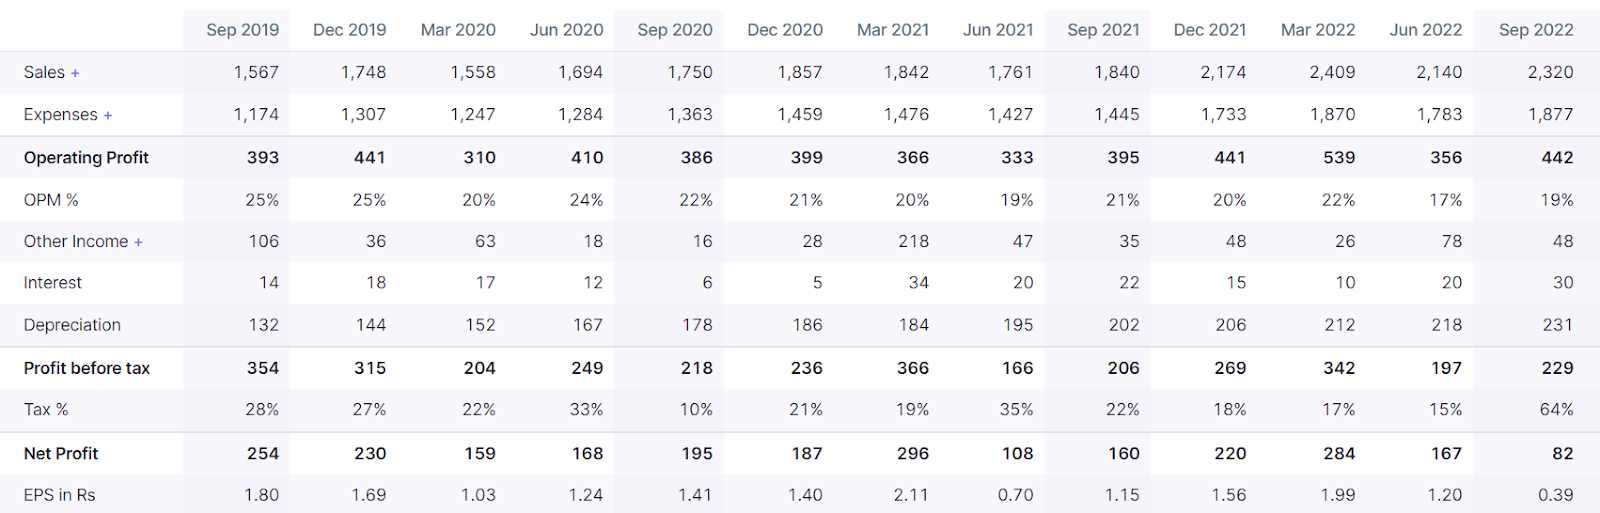
- There is an increase in QoQ sales.
- Operating profit has also grown on QoQ basis.
- Depreciation is almost the same as profit before tax.
- Tax has been very high in September 22 quarter.
Profit and Loss Statement

- Sales have increased from Rs. 1800 Cr. in Mar’11 to Rs. 9000 Cr. in TTM
- Operating Profits have increased from Rs.522 Cr.in Mar’11 to Rs. 1772 Cr. in TTM. Although material cost and employee costs have increased many folds during these years.
- The company is able to maintain a healthy OPM of 20%.
- Net Profit is on the higher side. The net profit is showing ups and downs over the years from 2011 to TTM because of irregular Other income and variations in taxes.
- Sales of the company are growing with a CAGR of 14- 15%.
Balance Sheet
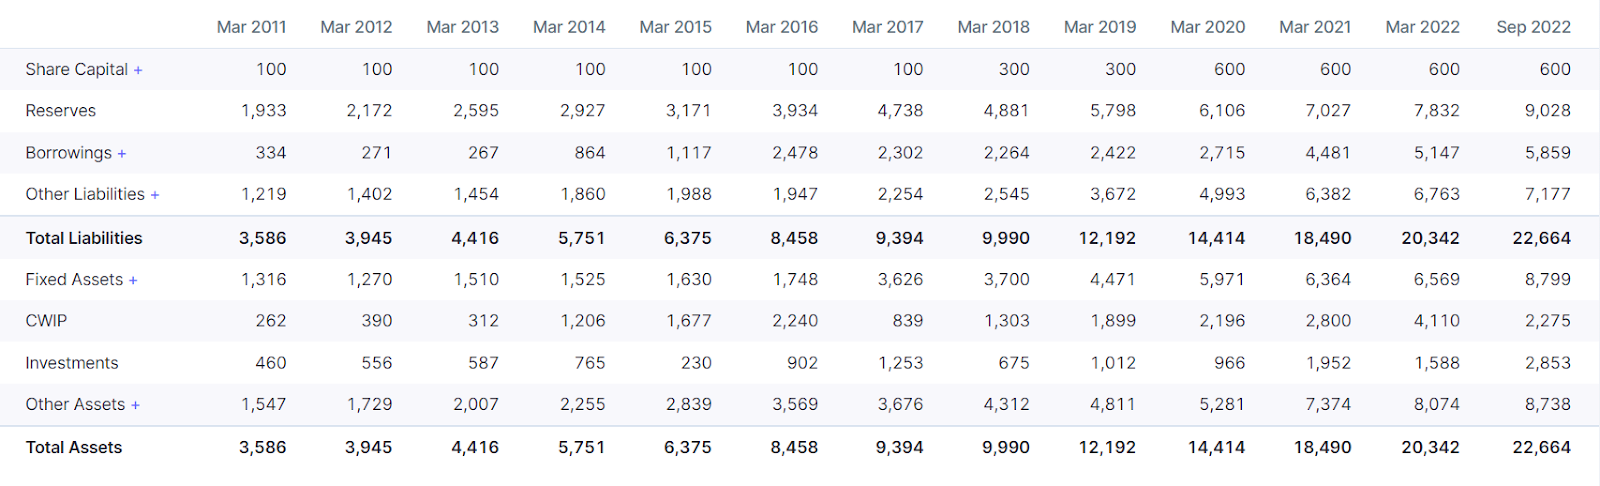
- The company has managed to increase its reserves from Rs. 1900 Cr. to Rs. 9000 Cr.
- The company has Debt to Equity ratio of 0.61% which accounts for the expansion of plants in Vishakhapatnam and Hyderabad facility.
- Fixed Assets have increased from Rs.1300 Cr.in Mar’11 to Rs. 8700 Cr. in TTM.
- The company is constantly expanding with Rs. 2275 Cr. CWIP still going on.
- Biocon Ltd. is able to maintain a healthy positive cash flow for the past 10 years.
Share Holding Pattern
| Share Holder | % holding |
| Promoters | 60.64 |
| FII | 14.42 |
| DII | 8.63 |
| Public | 15.74 |
| Others | 0.58 |
- Share holding pattern has remain pretty same over the years.
- Promoters have good share holding , a lot of skin in the game.
Biocon Ltd. – Technical Analysis
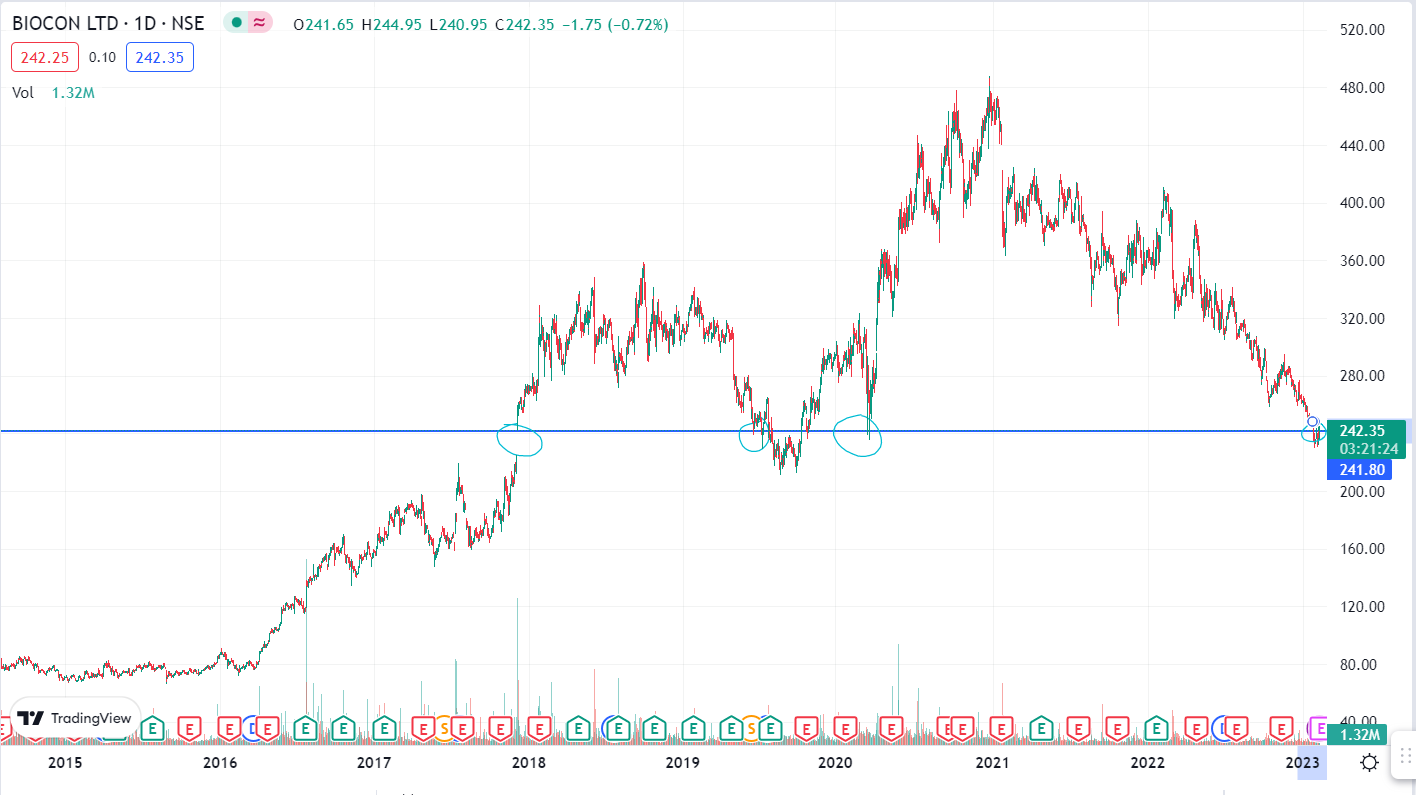
- Biocon Ltd. has posted the highest ever results on QoQ as well as YoY basis.
- The share price has shown a lot of fluctuations over the years.
- Biocon Ltd. is trading at December 2017 share price.
- 242 rupees is an important support level. the share price has taken support on the same level on December 17, June 19, July 19, October 19, and March 20.
- The share price is expected to go up from these levels.
- As the company is posting the highest-ever sales and highest-ever net profits it is expected to achieve its highest-ever share price i.e. Rs. 489 which can give its investors a gain of 100%.
- Entry in the stock at the levels of Rs. 200 to 260 would be an intelligent entry.
- Investors could exit as soon as the share price reaches its all-time high.
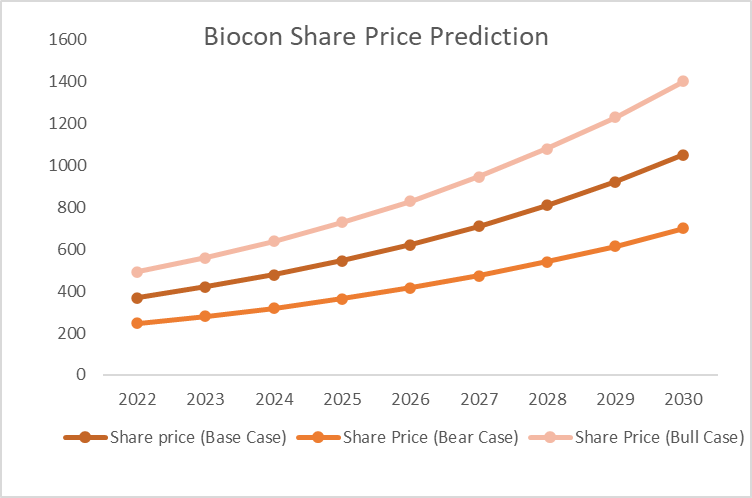
Biocon Ltd. – Share Price Prediction
Assumptions
- Historically Biocon Ltd. has shown a CAGR of 14% in revenue growth. Assuming sales grow by 14% we can project sales growth from the year 2023-2030.
- Projected Sales = Given Sales * 1.14 in this case
- Margins between Net Profit and sales have been between 7-18 %. Thus assuming margins as 9% we can calculate the projected profits.
- Projected Profit = Projected Sales * 0.09 in this case.
- PE has been variable from 31 to 112. So we consider PE in
Base case as- 60
Bear Case as- 40
Bull Case as:- 80
- Projected M. Cap = Projected Profit * Assumed PE
- Predicted Share Price = Projected M.Cap / No. of Shares
- No. of shares currently are 120 Cr.
| S.no. | Year | Projected Sales | Projected Net Profits |
| 1 | 2022 | 8182 | 736 |
| 2 | 2023 | 9327 | 839 |
| 3 | 2024 | 10633 | 957 |
| 4 | 2025 | 12122 | 1091 |
| 5 | 2026 | 13819 | 1244 |
| 6 | 2027 | 15754 | 1418 |
| 7 | 2028 | 17959 | 1616 |
| 8 | 2029 | 20474 | 1843 |
| 9 | 2030 | 23340 | 2101 |
Base Case
- In this case we have considered PE= 60 which is a median PE for Biocon share for last 5 years.
- M. cap is calculated by multiplying projected Net Profit by 60 which is PE we are assuming.
- To calculate the share price we have divided Mcap with the number of shares in Cr. i.e. 120.
| Year | PE (base case) | Mcap ( Base Case) ( In Cr.) | Share price (Base Case) |
| 2022 | 60 | 44183 | 368 |
| 2023 | 60 | 50368 | 420 |
| 2024 | 60 | 57420 | 478 |
| 2025 | 60 | 65459 | 545 |
| 2026 | 60 | 74623 | 622 |
| 2027 | 60 | 85070 | 709 |
| 2028 | 60 | 96980 | 808 |
| 2029 | 60 | 110557 | 921 |
| 2030 | 60 | 126035 | 1050 |
Bull Case
- In this case we have considered PE as 80 . Its highest PE in last 5 years is 112. Taking PE as 80 seems a safer bet
- M. cap is calculated by multiplying projected Net Profit by 80 which is PE we are assuming.
- To calculate the share price we have divided Mcap with the number of shares in Cr. i.e. 120.
| Year | Share price (Base Case) | Share Price (Bear Case) | Share Price (Bull Case) |
| 2022 | 368 | 245 | 491 |
| 2023 | 420 | 280 | 560 |
| 2024 | 478 | 319 | 638 |
| 2025 | 545 | 364 | 727 |
| 2026 | 622 | 415 | 829 |
| 2027 | 709 | 473 | 945 |
| 2028 | 808 | 539 | 1078 |
| 2029 | 921 | 614 | 1228 |
| 2030 | 1050 | 700 | 1400 |
Bear Case
- In this case we have considered PE as 40. Due to some circumstances if sentiments are weak for Biocon stock, market may give it a PE of 40. It may be less, but this is what we are assuming.
- M. cap is calculated by multiplying projected Net Profit by 40 which is PE we are assuming.
- To calculate the share price we have divided Mcap with the number of shares in Cr. i.e. 120.
| Year | PE (Bear Case) | Mcap (Bear Case) ( In Cr.) | Share Price (Bear Case) |
| 2022 | 40 | 29455 | 245 |
| 2023 | 40 | 33579 | 280 |
| 2024 | 40 | 38280 | 319 |
| 2025 | 40 | 43639 | 364 |
| 2026 | 40 | 49749 | 415 |
| 2027 | 40 | 56713 | 473 |
| 2028 | 40 | 64653 | 539 |
| 2029 | 40 | 73705 | 614 |
| 2030 | 40 | 84024 | 700 |
Read more about these multibaggers
Hathway Cables and Datacomm Ltd.

Use the link to open a Demat account in Zerodha
Disclaimer- All investments and trading in the stock market involve risk. Any decision to place a trade in the financial markets, including trading in stock should only be made after thorough research. Trading strategies or related information mentioned in the article is for informational purposes only. Use your due diligence before investing. These are just predictions. They may or may not be true.