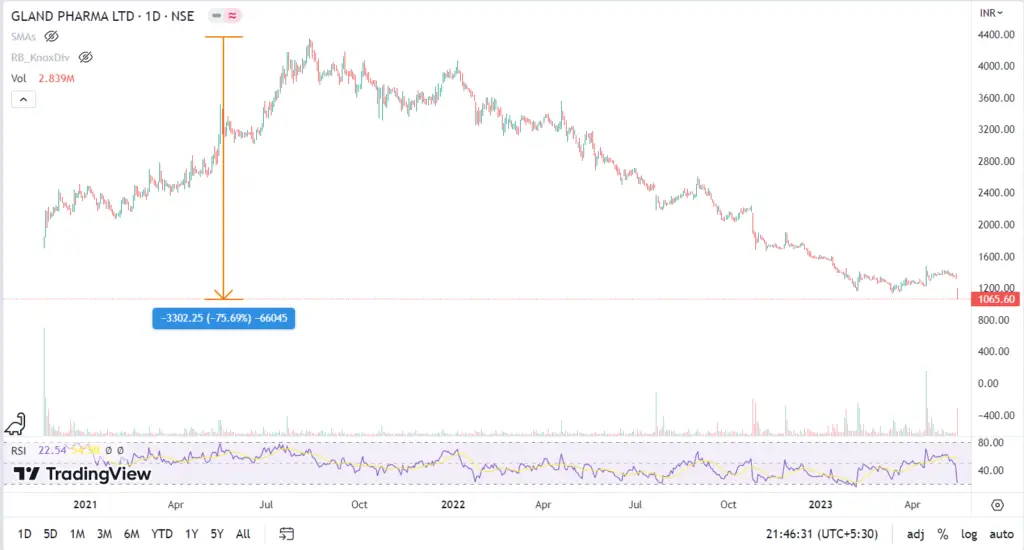
Gland Pharma is crashed by more than 75% from its lifetime high. Within one trading session it is fallen down by more than 10%. Are these valuations an opportunity or a trap?
Gland Pharma share seems to be available at good valuation. Knowing share price targets before investing will definitely help to have a clear vision regarding investment period and ups and downs share price could take during this period.
Let’s do some calculations to predict the share price targets of Gland Pharma.
Gland Pharma Buy Zone – Rs. 1200-1300 Target Price – Rs. 13000 by 2030
Gland Pharma Share Price Today
Here we will predict the share price target of Gland Pharma by predicting its Sales and Net Profit and the share price it can reach in all base cases, a bear case, and a bull case. You can also calculate in the same way according to your assumptions.
| Year | Share price (Bear Case) | Share Price (Base Case) | Share Price (Bull Case) |
| 2022 | 1227 | 2454 | 3681 |
| 2023 | 1472 | 2945 | 4417 |
| 2024 | 1767 | 3534 | 5300 |
| 2025 | 2120 | 4240 | 6360 |
| 2026 | 2544 | 5088 | 7633 |
| 2027 | 3053 | 6106 | 9159 |
| 2028 | 3664 | 7327 | 10991 |
| 2029 | 4396 | 8793 | 13189 |
| 2030 | 5276 | 10551 | 15827 |

Calculating Gland Pharma Share Price Target
We will predict the share price by predicting future sales and net profits. Then using historic PE we can calculate Market Capitalization and then the share price.
For this, we need :-
- Assumed Sales Growth
- Net Profit Margin

Assumed Sales Growth
Gland Pharma has shown a CAGR sales growth of 24% in the last 10 years.
Being conservative let us assume that the sales of Gland Pharma will keep growing like this by 20% for the next 7-10 years. Using this we can calculate project sales of Gland Pharma for years to come.
Assumed Sales Growth = 20%
Projected Sales (Next Year)= Sales Current Year + X% of Sales Current Year, where X= Assumed Sales Growth.
Eg:- Projected Sales 2023 = Sales 2022 + 20% Sales 2022.
| S.no. | Year | Projected Sales ( In Cr.) |
| 1 | 2022 | 4401 |
| 2 | 2023 | 5281 |
| 3 | 2024 | 6337 |
| 4 | 2025 | 7605 |
| 5 | 2026 | 9126 |
| 6 | 2027 | 10951 |
| 7 | 2028 | 13141 |
| 8 | 2029 | 15770 |
| 9 | 2030 | 18923 |
Net Profit Margin
Gland Pharma works on high operating margins of 28-47%. After Operating Profits, a company has to pay for other things like interest, depreciation, Tax, etc. So we need to have the Net Profit Margin also called PAT Margins of the company using historic data.
Company’s PAT Margins have been varying between 20% to 29% since Mar’18.
Read :- Zomato Share Price Prediction
| Sales | 1,620 | 2,044 | 2,633 | 3,463 | 4,401 | 3,934 |
| Net Profit | 321 | 452 | 773 | 997 | 1,212 | 983 |
| Net Profit Margin | 19.81 | 22.11 | 29.36 | 28.79 | 27.54 | 24.99 |
Average Net Profit Comes out to be more than 25%.
Let’s be conservative and assume that the company will able to maintain a Net Profit Margin of 23%.
Projected Profit = Projected Sales X Net Profit Margin
| S.no. | Year | Projected Sales ( In Cr.) | Projected Net Profit ( In Cr.) |
| 1 | 2022 | 4401 | 1012 |
| 2 | 2023 | 5281 | 1215 |
| 3 | 2024 | 6337 | 1458 |
| 4 | 2025 | 7605 | 1749 |
| 5 | 2026 | 9126 | 2099 |
| 6 | 2027 | 10951 | 2519 |
| 7 | 2028 | 13141 | 3023 |
| 8 | 2029 | 15770 | 3627 |
| 9 | 2030 | 18923 | 4352 |

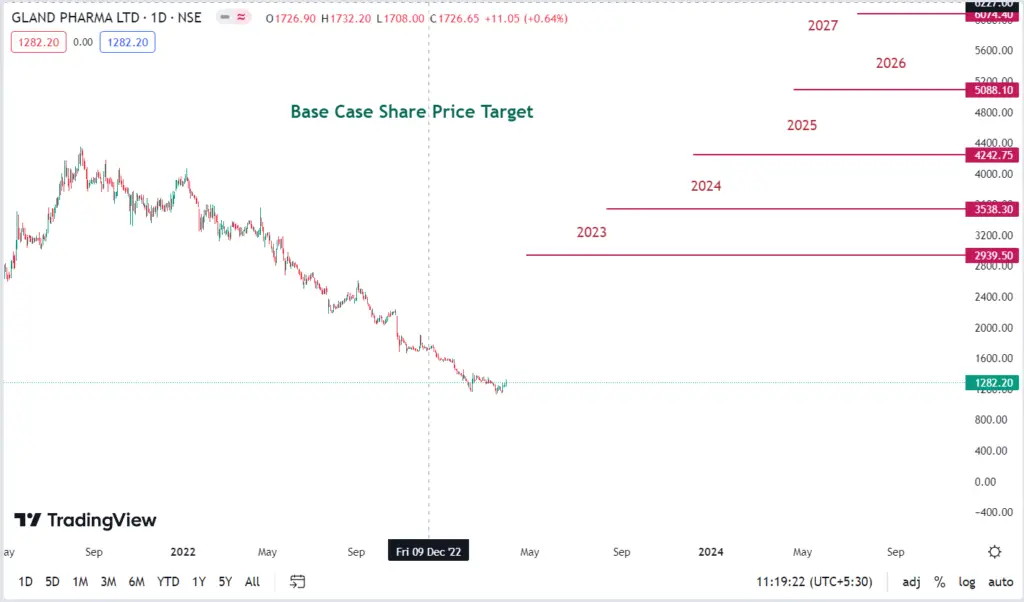
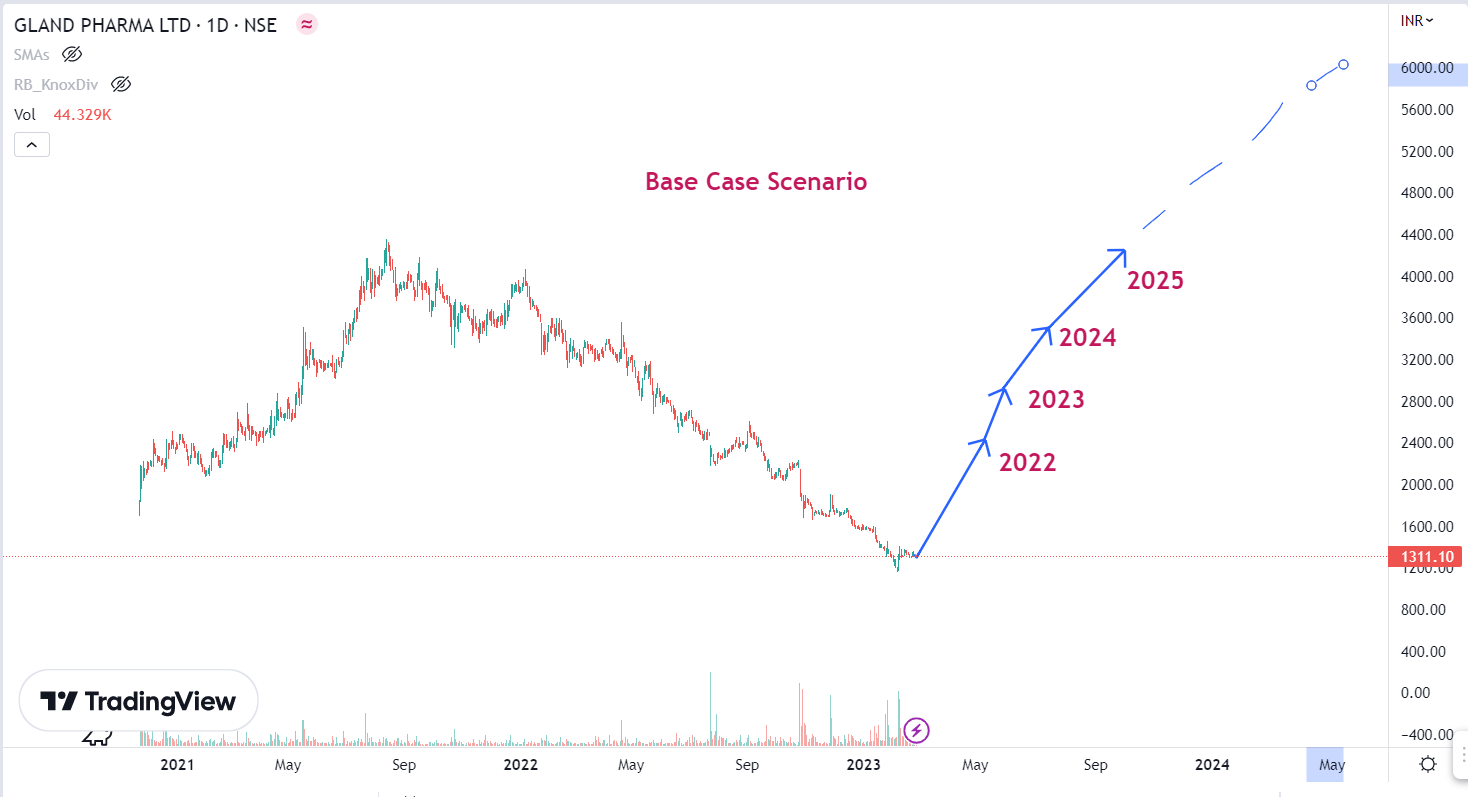
Gland Pharma Share Price Target Base Case
The share Price of a company is not only dependent on its earning but also on the sentiments of the market. PE often be used as indicator of market sentiments. If PE is high then market is quiet bullish for that particular stock and if PE is low then the market is bearish.
Ever since its listing PE of Gland Pharma has varied from 20 to 67. Average PE being 45. In our case lets assume
- PE in the base case be 40.
- PE in bear case be 20 and
- PE in bull case be 60.

Assumed Market Capitalization = Assumed Net Profit X Assumed PE
Share Price = Market Capitalization / No. of Shares.
No. of Shares of Gland Pharma are:- 16.5 Cr.
Read:- Biocon Share Price Target
| S.no. | Year | PE (base case) | M cap ( Base Case) ( In Cr.) | Share price (Base Case) |
| 1 | 2022 | 40 | 40489 | 2454 |
| 2 | 2023 | 40 | 48587 | 2945 |
| 3 | 2024 | 40 | 58304 | 3534 |
| 4 | 2025 | 40 | 69965 | 4240 |
| 5 | 2026 | 40 | 83958 | 5088 |
| 6 | 2027 | 40 | 100750 | 6106 |
| 7 | 2028 | 40 | 120900 | 7327 |
| 8 | 2029 | 40 | 145080 | 8793 |
| 9 | 2030 | 40 | 174096 | 10551 |
Gland Pharma Share Price Target Bear Case
Considering PE = 20 Let’s calculate M cap and Share Price
| S.no. | Year | PE (Bear Case) | M cap (Bear Case) ( In Cr.) | Share Price (Bear Case) |
| 1 | 2022 | 20 | 20245 | 1227 |
| 2 | 2023 | 20 | 24294 | 1472 |
| 3 | 2024 | 20 | 29152 | 1767 |
| 4 | 2025 | 20 | 34983 | 2120 |
| 5 | 2026 | 20 | 41979 | 2544 |
| 6 | 2027 | 20 | 50375 | 3053 |
| 7 | 2028 | 20 | 60450 | 3664 |
| 8 | 2029 | 20 | 72540 | 4396 |
| 9 | 2030 | 20 | 87048 | 5276 |
Gland Pharma Share Price Target Bull Case
Taking PE as 60, assuming market is highly bullish for Gland Pharma, Let’s calculate M cap and Share Price.
| S.no. | Year | PE (Bull Case) | M cap (Bull Case) ( In Cr.) | Share Price (Bull Case) |
| 1 | 2022 | 60 | 60734 | 3681 |
| 2 | 2023 | 60 | 72881 | 4417 |
| 3 | 2024 | 60 | 87457 | 5300 |
| 4 | 2025 | 60 | 104948 | 6360 |
| 5 | 2026 | 60 | 125938 | 7633 |
| 6 | 2027 | 60 | 151125 | 9159 |
| 7 | 2028 | 60 | 181350 | 10991 |
| 8 | 2029 | 60 | 217620 | 13189 |
| 9 | 2030 | 60 | 261144 | 15827 |
In this way we have actually calculated how the Share Prices of Gland Pharma fluctuate with time.
Gland Pharma Share Price Target 2023
| Year | Share Price (Bear Case) | Share Price (Base Case) | Share Price (Bull Case) |
| 2023 | 1472 | 2945 | 4417 |
Currently the share price of Gland Pharma is falling down. It is at its 52 weeks low. The share price is even lower than its IPO price. Nifty Pharma is also falling since October 21. It has corrected by 19-20 % since its lifetime high.
Gland Pharma has posted weak results in its Q4FY23. Mar ’23 quarter has shown a dip in the sales of the company as compared to the same quarter last year i.e. Mar’22. OPM has also declined. Other income is negative and tax has grown from 25 to 29%. Lets find the answer why?
Revenue of Q4FY23 has declined by 29% because of because of shutting down of one of its facilities in Pashamylaram Pemes due line upgradation and capacity plans. With completion of the upgradation plans the sales are expected to go up and hence the revenues.
There was reduction in domestic B2C business and normalization of demand after COVID 19 are also reasons for the poor revenues.
Inventory rationalization , high pricing pressure and increased competition has impacted revenues and margins in U.S. markets.
Coming on to the OPM, even with reduced sales the company’s fixed expenses remains the same. With capacity expansion, expenses increases with more number of heads working for the completion of expansion. This directly affects the operating margins of the company.
Other income of Gland Pharma is negative because one of its U.S. customer has files for bankruptcy with an outstanding payment of Rs.564 million.
The share price of Gland Pharma is in the range of Rs.1000 which is a very good opportunity for investors to buy it right now. Short term traders can buy it at this point and can move out as soon as the target of Rs. 1600 is achieved .
It is a perfect time to buy this stock according to 3X3 strategy. The stock is undervalued and has a lot of potential.
All those who are apprehensive about it can wait for 1-2 quarters for better results before investing.
Read:- Small Cap Stocks to Buy Now
Gland Pharma Share Price Target 2024
| Year | Share Price (Bear Case) | Share Price (Base Case) | Share Price (Bull Case) |
| 2024 | 1767 | 3534 | 5300 |
- Gland Pharma has grown its sales 10 times from 400 Cr. in Mar’11 to 4000 Cr. in Mar ’22.
- Operating profit has grown from 112 Cr. to 1600 Cr. in same period of time.
- The company has always kept very low debt and hence no profit is lost because of interest payment.
- This shows company is a profitable business with very good management.
- With expansion of its Pemes Plant the revenues are expected to grow further.
- Gland Pharma has acquired the business of Cenexi which is expected to open up opportunities of the company in the European markets.
Gland Pharma Share Price Target 2025
| Year | Share Price (Bear Case) | Share Price (Base Case) | Share Price (Bull Case) |
| 2025 | 2120 | 4240 | 6360 |
- Gland Pharma has increased its reserves from 340 Cr. in Mar’11 to 7633 Cr. in Mar’22.
- It has increased its fixed assets to almost 10 times.
- 125 Cr. worth CWIP is still going on which will enhance manufacturing and hence revenue of the company.
- Gland Pharma is not taking debt for expansion. It is using its own money efficiently.
- It is a cash rich company.
- The company is launching new products every year. It has 263 approved ANDA filling and 71 filling pending. With more approvals , more products are expected to be launched thereby increasing product portfolio.
- The company is already working towards building biosimilars and biological CDMO capabilities. With success in these a diversified product portfolio is expected to grow.
Gland Pharma Share Price Target 2030
| Year | Share Price (Bear Case) | Share Price (Base Case) | Share Price (Bull Case) |
| 2030 | 5276 | 10551 | 15827 |
- Gland Pharma has a positive cashflow which matches with its Net Profits.
- DII’s are constantly investing in this company.
- With acquisition of Phixen SAS France, doing business as Cenexi, The company own its niche formulations, steriles and solids.
- The company is focusing on geographic expansion in the emerging markets . Through this the revenues and profitability is expected to grow.
Conclusion
- Gland Pharma has very good financials and is trading more than 75% down from its highest share price.
- It is a great opportunity to enter Gland Pharma as it is available at a PE of less than 20 while its median PE is 40. The company at this point is showing great financials and low valuations.
- The company has shown constant increase in sales and profits throughout these years. There is a little bit dip in TTM that is because the demand that increased excessively due to COVID- 19 has normalized.
- ROCE of the company has always been more than 22% which shows company has good management , services and products.
- DII’s have increased their stakes by 10% in the past quarters is a good sign.
- Long-term investors can definitely invest in this company and enjoy huge returns.
- It is a debt free company , so every thing it earns can be used for upliftment of the company.
- A horizon of atleast 3 years or reaching life time high can make good returns for the investors.
- The company is expanding and that to without debt says a lot about its abilities.
FAQ
Is Gland Pharma a good buy?
Right now Gland Pharma is trading around Rs. 1200-1300 Levels which are also below 200 day moving average. It is a debt free company with excellent financials is available at low valuations. This is a good time to buy. Buying Gland Pharma at levels less than Rs. 1200 seems pretty good. It is also trading near its 52 weeks low. Investing at 52 weeks low for 20% gain can give good results
What is the future of Gland Pharma?
Gland Pharma has grown from being contract manufacturers to generic injectable manufacturing company. The company has shown exponential growth under its Promoters , Shanghai Fosun Pharma. The company has its R&D facilities where they are focusing on manufacturing more injectables at attractive prices. They have expertise in synthesizing complex molecules into complex injectables thereby developing niche products for diverse markets worldwide.
Will Gland Pharma recover?
There is no problem in the financials of Gland Pharma. It has ROCE of 34%, PEG ratio of 0.9, CAGR Sales of 24%, and CAGR Profit of 28% for the past 10 years, Debt free company. With this kind of financials, Gland Pharma is bound to recover. It may take some time, it is when there is opportunity and patience test for investors .
Other Small Cap stocks worth investing right now are:-
Use the link to open a Demat account in Zerodha.
Disclaimer- All investments and trading in the stock market involve risk. Any decision to place a trade in the financial markets, including trading in stock should only be made after thorough research. Trading strategies or related information mentioned in the article is for informational purposes only. Use your due diligence before investing. These are just predictions. They may or may not be true.