

Nippon India share is available at attractive valuations. Should I invest or wait for further fall?
Let us calculate the share price targets of Nippon India to have a better vision about its share.
Buy Range – Rs. 220-240,
Target-Rs.480.
Nippon Life India Asset Management Ltd also called NAM-INDIA is a good stock to buy now.
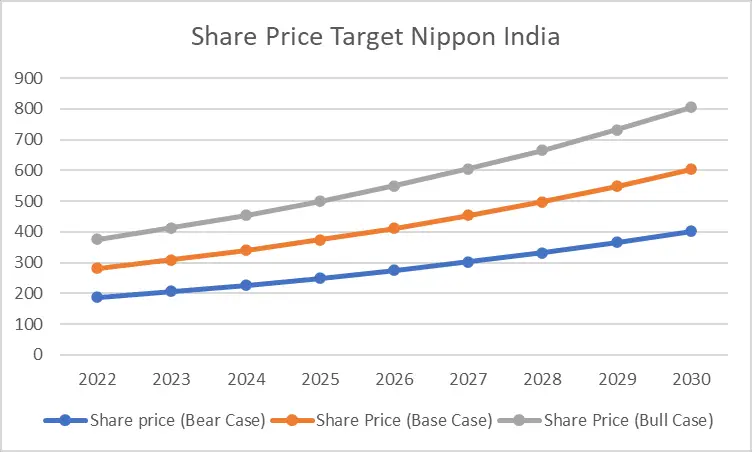
Nippon Life India Share Price Today
| Year | Share price (Bear Case) | Share Price (Base Case) | Share Price (Bull Case) |
| 2022 | 188 | 282 | 375 |
| 2023 | 206 | 310 | 413 |
| 2024 | 227 | 341 | 454 |
| 2025 | 250 | 375 | 500 |
| 2026 | 275 | 412 | 550 |
| 2027 | 302 | 453 | 605 |
| 2028 | 333 | 499 | 665 |
| 2029 | 366 | 549 | 732 |
| 2030 | 402 | 604 | 805 |
─
Nippon India is the largest asset management company involved in managing mutual funds including ETF’s, portfolio management services, alternate investment funds, and pension fund. It is right now available at 2019 levels which makes it a very good investment opportunity.
Read :- Zomato Share Price Prediction
Nippon India Share Price
Calculating Nippon India Share Price Target
We will calculate the share price of Nippon India by predicting the future sales and net profits it can make in years to come . Taking reference from the historic PE we can then calculate the Market Capitalisation and Share Price Target for coming years 2023-2030.
For this calculation we need:-
- Assumed sales growth
- Net profit margins
- Median PE which can be taken as base case
- Number of shares of the company
Read:-Biocon Share Price Target
Assumed Sales Growth
- CAGR Sales of Nippon India is 8% for last 10 years.
- Post COVID their has been a lot of changes In the way people think about Investments.
- there has been a shift towards Technology And people have started investing more in mutual funds and share market.
- The Indian Asset Management market Is expected to reach USD 20 billion by 2027, registering a CAGR of 14% over next 5 years.
- taking all these things in account let us assume that Nippon India is going to show sales growth of at least 10% in next few years.
- Assumed Sales Growth = 10%
Net Profit Margin
- Using the historic data, we know that the net profit margins or PAT Margins have been between 27 to 55 %
- We can use these net profit margins to calculate the profits the company is going to make using the predicted sales.
- We take PAT Margins as Average i.e. around 41%.
Average net profit margin = 41%.
PE
- Over the years the company has shown PE ranging from 1-50. Median PE being 30.
- PE Is an indicator of the emotions of the market. when be is high that means the market is bullish whereas a low PE indicates bearishness.
- We can assume :-
Base Case PE = 30
Bear Case PE = 20
Bull Case PE = 40
Number of Shares
- Number of shares of Nippon India are 62.3 CR.
Calculating Nippon India Projected Sales and Net Profit
- Projected Sales (Next Year)= Sales Current Year + X% of Sales Current Year, where X= Assumed Sales Growth.
Eg:- Projected Sales 2023 = Sales 2022 + 10% Sales 2022.
- Projected Profit = Projected Sales X Net Profit Margin
| S.no. | Year | Projected Sales ( In Cr.) | Projected Net Profit ( In Cr.) |
| 1 | 2022 | 1426 | 585 |
| 2 | 2023 | 1569 | 643 |
| 3 | 2024 | 1725 | 707 |
| 4 | 2025 | 1898 | 778 |
| 5 | 2026 | 2088 | 856 |
| 6 | 2027 | 2297 | 942 |
| 7 | 2028 | 2526 | 1036 |
| 8 | 2029 | 2779 | 1139 |
| 9 | 2030 | 3057 | 1253 |

Nippon India Share Price Target BASE Case
- In this case, we will assume that the market is neither too bulish or too bearish in regard to Nippon India.
- We will assume that the share is trading at its median PE i.e. 30.
- This pe will help us calculate market capitalisation of Nippon India at that time
Projected Market Capitalization = Projected Net Profit X Assumed PE
Share Price = Market Capitalization / No. of Shares.
| S.no. | Year | PE (base case) | Mcap ( Base Case) ( In Cr.) | Share price (Base Case) |
| 1 | 2022 | 30 | 17540 | 282 |
| 2 | 2023 | 30 | 19294 | 310 |
| 3 | 2024 | 30 | 21223 | 341 |
| 4 | 2025 | 30 | 23345 | 375 |
| 5 | 2026 | 30 | 25680 | 412 |
| 6 | 2027 | 30 | 28248 | 453 |
| 7 | 2028 | 30 | 31073 | 499 |
| 8 | 2029 | 30 | 34180 | 549 |
| 9 | 2030 | 30 | 37598 | 604 |
Nippon India Share Price Target BEAR Case
- In this case, we assume that due to some reasons ( bad news decrease in sales, the market is overall down ,etc.) the market is Bearish about Nippon India. in such case, the share will trade at lower PE.
- Let the PE be 20
| S.no. | Year | PE (Bear Case) | Mcap (Bear Case) ( In Cr.) | Share Price (Bear Case) |
| 1 | 2022 | 20 | 11693 | 188 |
| 2 | 2023 | 20 | 12863 | 206 |
| 3 | 2024 | 20 | 14149 | 227 |
| 4 | 2025 | 20 | 15564 | 250 |
| 5 | 2026 | 20 | 17120 | 275 |
| 6 | 2027 | 20 | 18832 | 302 |
| 7 | 2028 | 20 | 20715 | 333 |
| 8 | 2029 | 20 | 22787 | 366 |
| 9 | 2030 | 20 | 25065 | 402 |
Nippon India Share Price Target BULL Case
- Let us assume that the market is bullish for Nippon India. there is some very good news like a big client acquisition or the entire market is going up.
- In such a case, Nippon India will be trading at Higher PE.
- Let us assume PE at that time to be 40.
| S.no. | Year | PE (Bull Case) | Mcap (Bull Case) ( In Cr.) | Share Price (Bull Case) |
| 1 | 2022 | 40 | 23386 | 375 |
| 2 | 2023 | 40 | 25725 | 413 |
| 3 | 2024 | 40 | 28298 | 454 |
| 4 | 2025 | 40 | 31127 | 500 |
| 5 | 2026 | 40 | 34240 | 550 |
| 6 | 2027 | 40 | 37664 | 605 |
| 7 | 2028 | 40 | 41430 | 665 |
| 8 | 2029 | 40 | 45573 | 732 |
| 9 | 2030 | 40 | 50131 | 805 |
Nippon India Share Price Target 2023
| Year | Share price (Bear Case) | Share Price (Base Case) | Share Price (Bull Case) |
| 2023 | 206 | 310 | 413 |
Nippon India Share Price Target 2024
| Year | Share price (Bear Case) | Share Price (Base Case) | Share Price (Bull Case) |
| 2024 | 227 | 341 | 454 |
Nippon India Share Price Target 2025
| Year | Share price (Bear Case) | Share Price (Base Case) | Share Price (Bull Case) |
| 2025 | 250 | 375 | 500 |
Read:- Gland Pharma Share Price Target
Nippon India Share Price Target 2030
| Year | Share price (Bear Case) | Share Price (Base Case) | Share Price (Bull Case) |
| 2030 | 402 | 604 | 805 |

Other Small Cap stocks worth investing right now are:-

Use the link to open a Demat account in Zerodha.
Disclaimer- All investments and trading in the stock market involve risk. Any decision to place a trade in the financial markets, including trading in stock should only be made after thorough research. Trading strategies or related information mentioned in the article is for informational purposes only. Use your due diligence before investing. These are just predictions. They may or may not be true.