
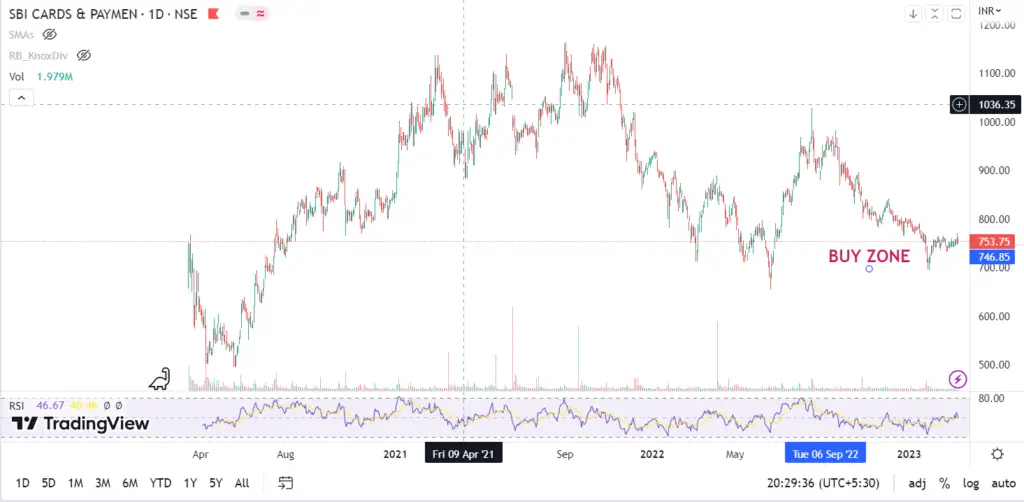
Buy Range:- Rs. 700-800 Target:- Rs. 9000 by 2030
SBI Cards & Payment Services are available at low valuations right now. It is a very good opportunity to buy it right now. Let’s calculate and see what share price targets it can achieve in the future.
SBI Card Share Price Today
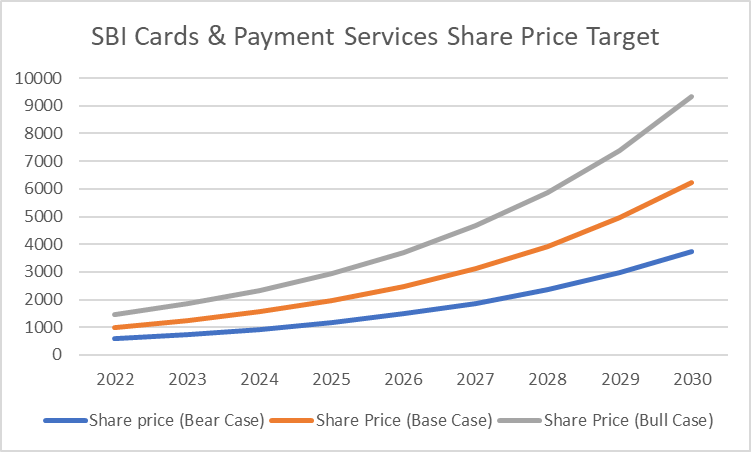
| Year | Share price (Bear Case) | Share Price (Base Case) | Share Price (Bull Case) |
| 2022 | 587 | 983 | 1468 |
| 2023 | 740 | 1239 | 1849 |
| 2024 | 932 | 1561 | 2330 |
| 2025 | 1174 | 1967 | 2936 |
| 2026 | 1480 | 2478 | 3699 |
| 2027 | 1864 | 3123 | 4661 |
| 2028 | 2349 | 3934 | 5872 |
| 2029 | 2960 | 4957 | 7399 |
| 2030 | 3729 | 6246 | 9323 |
Calculating SBI Cards & Payment Services Share Price Target
In this article, we will try to predict the future of SBI Cards & Payments using its historical data. By using the historic performance, we will try to calculate the sales this company can make in the future. These sales will help us calculate the Profits it will make and then we can calculate the Market Capitalization it can reach and thereby calculating its share price.
Therefore, to calculate the share price we need to calculate the:-
- Predicted Sales – To calculate Predicted sales we need the growth rate by which the sales are growing over the years. So we need to assume sales growth with which the sales will grow in the future.
- Predicted Profits – To calculate Predicted Profits we need to have Net Profit Margin also called PAT Margin.
- Market Capitalization – To calculate Market Capitalization we need PE the market is going to give the company at any point in time.
- Share Price – For calculating the Share Price we need No. of shares of the company.
Assumed Sales Growth
- SBI Cards is involved in issuing of credit cards to its customers.
- Credit card penetration is very low in India. In India, 3 out of 100 people use credit cards while the world benchmark is 30%. This shows a lot of growth from here.
- Government recently backed credit cards by linking UPI with Rupay credit card. This will increase credit card acceptance by 30%.
- This new rule would be a game changer and would be boosting the penetration of credit cards on digital platforms.
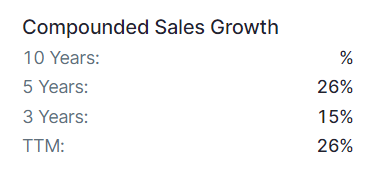
- By observing the given data let’s assume the sales growth of SBI Cards keeps increasing by 26%. Although we believe that it will be more than that being conservative about the future let’s stick with the current scenario.
- Assumed Sales Growth = 26%
Net Profit Margin
- We can calculate the Net Profit Margins using historic 5-year Sales and Net Profit.
- Net Profit Margin = (Net Profit X 100) / Sales
| Mar-18 | Mar-19 | Mar-20 | Mar-21 | Mar-22 | TTM | |
| Sales | 5,195 | 7,017 | 9,281 | 9,301 | 10,679 | 12,755 |
| Net Profit | 601 | 865 | 1,245 | 985 | 1,616 | 2,243 |
| Net Profit Margin | 12 | 12 | 13 | 11 | 15 | 18 |
- Calculating 5-year Profit Margin we can take out its average for better predictions.
- Average Net Profit =13%.
- This margins may improve in future with increase in sales but we will still use the 5-year average.
- Net Profit Margin can be used to calculate future Net Profits.
PE
- A company posts its Profit and Loss statement 4 times a year but the share price keeps moving up and down.
- The share price of a company is not only dependent on its financials but also on the market sentiments.
- We can easily get companies posting the highest-ever results available at the lowest-ever prices and on the other hand companies posting losses available at the highest-ever prices.
- These market sentiments can be measured through PE. Higher PE means market sentiments are positive and vice a versa.
- PE of SBI Cards have been varing from 31-119 with median PE being 67.
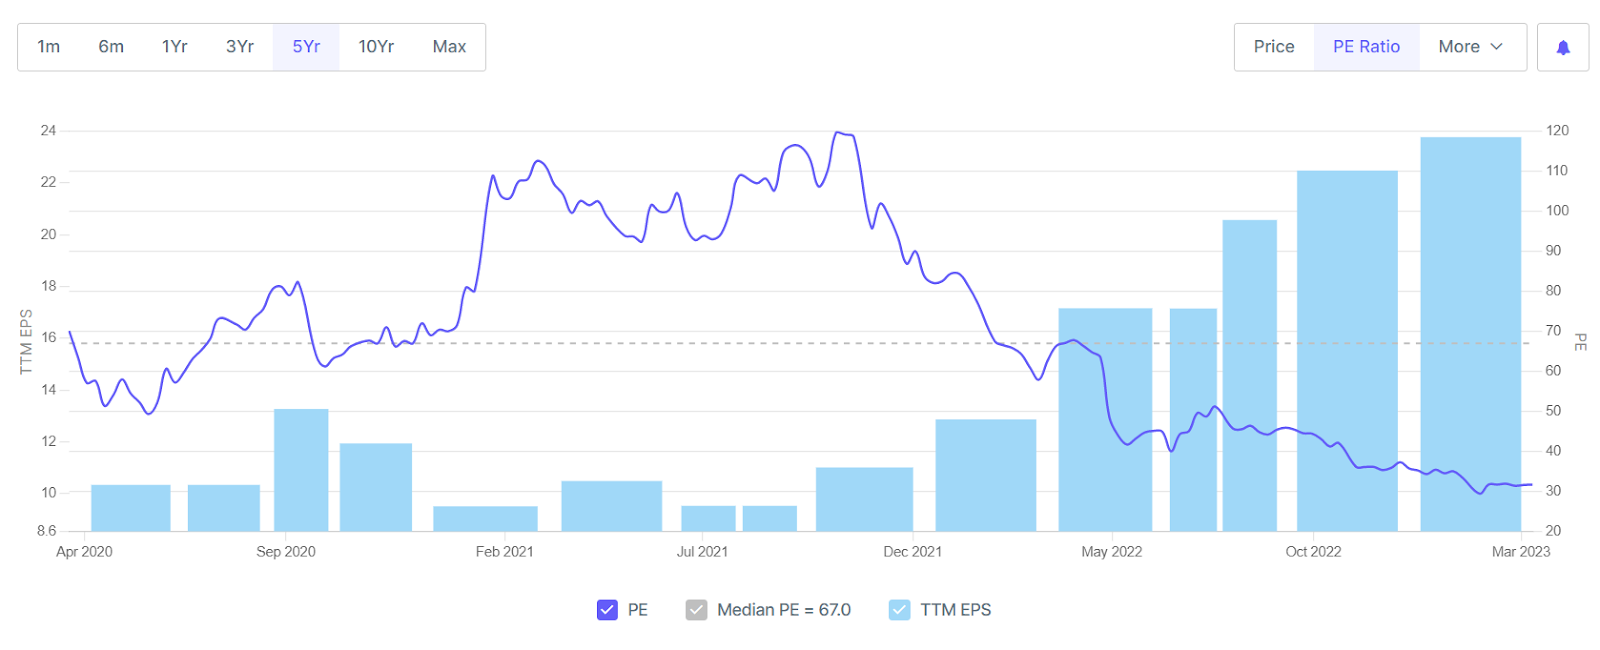
- Base Case – In this case, Let’s assume that the market is neutral, neither bullish nor bearish. In this case we will be using Median PE as base PE.
- Bear Case – The share price cannot keep rising with rising performance of the company. There would be times when market emotions would be low for SBI cards, then it would be given a lower PE. From the diagram above Let’s take it 40. You can assume according to yourself and calculate in the similar manner.
- Bull Case – The highest PE has been 119 but lets be practical and use PEas 100 in bullish times.
Base Case – 67
Bear Case – 40
Bull Case – 100
Number of Shares
The company has 94.6 Cr. of shares.
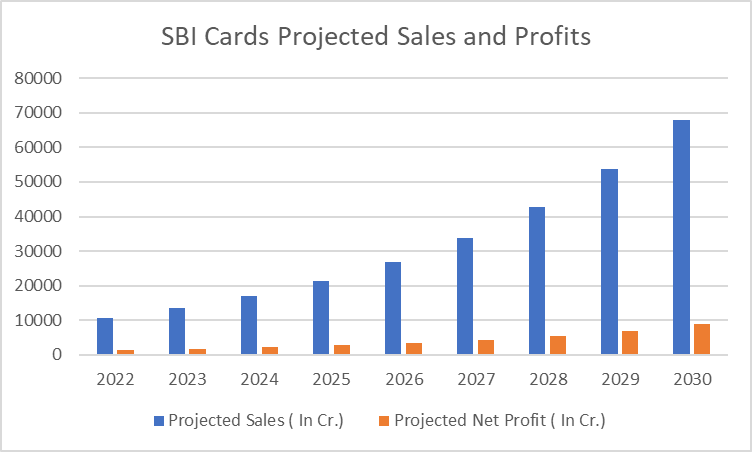
Calculating SBI Cards & Payment Services Projected Sales and Net Profit
- Using our assumptions of Sales Growth and Net Profit margins we can easily calculate the Sales and Net Profits the company would make in the coming years using formulas below.
- Projected Sales (Next Year)= Sales Current Year + X% of Sales Current Year, where X= Assumed Sales Growth.
Eg:- Projected Sales 2023 = Sales 2022 + 26% Sales 2022.
- Projected Profit = Projected Sales X Net Profit Margin
- Historic data can be fetched from www.screener.com
| Year | Projected Sales ( In Cr.) | Projected Net Profit ( In Cr.) |
| 2022 | 10679 | 1388 |
| 2023 | 13456 | 1749 |
| 2024 | 16954 | 2204 |
| 2025 | 21362 | 2777 |
| 2026 | 26916 | 3499 |
| 2027 | 33914 | 4409 |
| 2028 | 42732 | 5555 |
| 2029 | 53842 | 7000 |
| 2030 | 67841 | 8819 |
SBI Cards & Payment Services Share Price Target Base Case
- This is a base case scenario where we consider that the company is growing as it is and market is neutral towards it.
- Here we take median PE as our Base PE.
- We will use this PE to calculate MCap and share price of the company.
- Market Capitalization = Future Profit X Base PE.
- Share Price = Mcap / No. of Shares
| Year | PE (base case) | Mcap ( Base Case) ( In Cr.) | Share price (Base Case) |
| 2022 | 67 | 93014 | 983 |
| 2023 | 67 | 117198 | 1239 |
| 2024 | 67 | 147669 | 1561 |
| 2025 | 67 | 186063 | 1967 |
| 2026 | 67 | 234440 | 2478 |
| 2027 | 67 | 295394 | 3123 |
| 2028 | 67 | 372196 | 3934 |
| 2029 | 67 | 468967 | 4957 |
| 2030 | 67 | 590899 | 6246 |
SBI Cards & Payment Services Share Price Target Bear Case
- As above we will calculate Mcap and Share Price of SBI cards in bear case.
- Only difference would be its PE.
- We have taken PE for bear case as 40.
- This data shows how the share prices of a company could fall when the market feels negative about any company.
| Year | PE (Bear Case) | Mcap (Bear Case) ( In Cr.) | Share Price (Bear Case) |
| 2022 | 40 | 55531 | 587 |
| 2023 | 40 | 69969 | 740 |
| 2024 | 40 | 88161 | 932 |
| 2025 | 40 | 111082 | 1174 |
| 2026 | 40 | 139964 | 1480 |
| 2027 | 40 | 176355 | 1864 |
| 2028 | 40 | 222207 | 2349 |
| 2029 | 40 | 279980 | 2960 |
| 2030 | 40 | 352775 | 3729 |
Read :- Zomato Share Price Prediction
SBI Cards & Payment Services Share Price Target Bull Case
- In positive market outlook, the market will give SBI Cards a higher PE and its share prices will rise and touch highest ever prices.
- We have taken Bull Case PE as 100.
- You can do same calculations, using same formulas with PE of your choice.
| PE (Bull Case) | Mcap (Bull Case) ( In Cr.) | Share Price (Bull Case) |
| 100 | 138827 | 1468 |
| 100 | 174922 | 1849 |
| 100 | 220402 | 2330 |
| 100 | 277706 | 2936 |
| 100 | 349910 | 3699 |
| 100 | 440886 | 4661 |
| 100 | 555517 | 5872 |
| 100 | 699951 | 7399 |
| 100 | 881938 | 9323 |
Read : JK Paper Share Price Target
SBI Cards & Payment Services Share Price Target 2023
- SBI Card is posting an excellent ROE of 23%.
- TTM sales of the company are Rs 12755 which is highest ever sales .
- The company has posted highest ever Profits but still it is trading at lowest ever prices.
- This is a golden chance to invest in SBI Cards.
| Year | Share price (Bear Case) | Share Price (Base Case) | Share Price (Bull Case) |
| 2023 | 740 | 1239 | 1849 |
Read: Tata Elxsi Share Price Target
SBI Cards & Payment Services Share Price Target 2024
- SBI Cards is run by SBI team. A good management which has taken the company from Sales of Rs. 1008 to Rs. 12755 approx 13 times in 12 years from 2013 to TTM.
- PAT has increased from 136 Cr. to 3010 Cr. from 2013 to TTM.
- Gross NPAs and Net NPAs have been maintained at the lower sides.
- The share price oF SBI Bank will range from Rs.932 to Rs.2330 in 2024.
| Year | Share price (Bear Case) | Share Price (Base Case) | Share Price (Bull Case) |
| 2024 | 932 | 1561 | 2330 |
Read:- Nippon India Share Price Target
SBI Cards & Payment Services Share Price Target 2025
- The penetration of credit cards will further increase in upcoming years and the business of SBI Cards will prosper .
- Reserves have already increased from -332 to 7976 Cr which will further increase.
- Fixed assets have risen from 1 Cr. to 440 Cr. which will support the growth of the company further.
| Year | Share price (Bear Case) | Share Price (Base Case) | Share Price (Bull Case) |
| 2025 | 1174 | 1967 | 2936 |
Read More:- Jyoti Resins Share Price target
SBI Cards & Payment Services Share Price Target 2030
- Since it is a NBFC company, so debt is higher. It has business of taking loans and giving loans at higher rates and hence earning some profit.
- We only consider ROE in such cases which alway have been above 17% and reaching upto 49% which is not possible without a great management.
- Entire company is in very strong hands of Promoters, FII, DIIs, with public holding just being 5%. This proves the worth of SBI Cards.
| Year | Share price (Bear Case) | Share Price (Base Case) | Share Price (Bull Case) |
| 2030 | 3729 | 6246 | 9323 |
Conclusion
- Retail investors should invest in these kind of companies whenever there is an opportunity.
- This company can be kept in portfolio for long term for multibagger returns.
- There is a rare mix of best management, high growth potential, big name with this company.
- Buying at every dip and holding for long term is suggested.
- Right now the company has posted highest ever sales and highest ever profits with lowest ever prices. It is a great time to buy.
- This is a low risk – high reward share , where one can do SIP as well.
- Share Prices in bear and bull case can be considered as reference points for buying and selling for the investors.

Use the link to open a Demat account in Zerodha.
Disclaimer- All investments and trading in the stock market involve risk. Any decision to place a trade in the financial markets, including trading in stock should only be made after thorough research. Trading strategies or related information mentioned in the article is for informational purposes only. Use your due diligence before investing. These are just predictions. They may or may not be true. We are not SEBI registered analysts.