For long-term investors, the buy zone for IEX is around Rs. 100 and Target Price Rs. 587.
In this article, we will learn about: –
- What will be the future sales of IEX?
- What will be the future prices of IEX?
- Will IEX turn into a multi-bagger?
- Is it good to invest in IEX?
- When to enter and exit from IEX share?
This article will help the investor better understand when and why to invest in IEX.
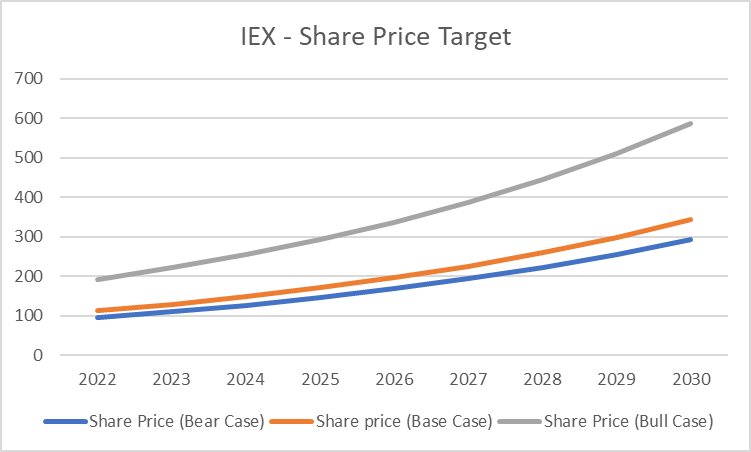
IEX Share Price Target 2023, 2024, 2025, 2030
| Year | Share Price (Bear Case) | Share price (Base Case) | Share Price (Bull Case) |
| 2022 | 96 | 112 | 192 |
| 2023 | 110 | 129 | 221 |
| 2024 | 127 | 148 | 254 |
| 2025 | 146 | 170 | 292 |
| 2026 | 168 | 196 | 336 |
| 2027 | 193 | 225 | 386 |
| 2028 | 222 | 259 | 444 |
| 2029 | 255 | 298 | 511 |
| 2030 | 294 | 343 | 587 |
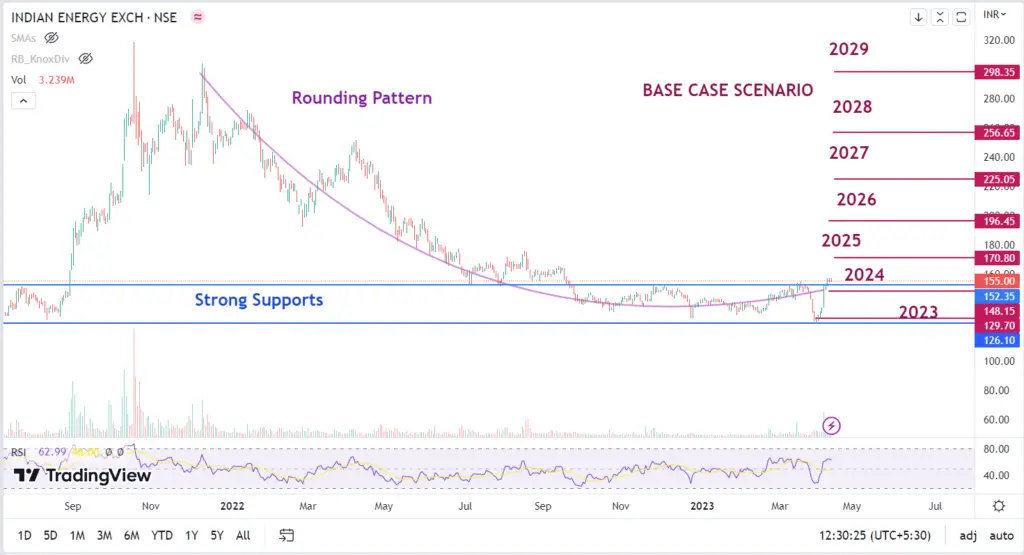
Credit: www.tradingview.com
If you wish to know how we have calculated these share prices read below for details.
IEX Share Price Today
About IEX
- IEX is a nation wide, automated and transparent trading platform for physical delivery of electricity, renewables and certificates.
- IEX commenced its operations in 2008 and got listed on NSE and BSE in 2017.
- IEX enjoys monopoly status with market share of more than 94%.
- Earlier there were only two exchanges IEX and PXIL. Third one HPX has now come into the picture.
- IEX launched the first Gas Exchange in India in 2020 and is dealing with its trading and physical delivery.
| Market Capitalization | 13,942 |
| ROCE | 62.1 |
| Debt to Equity | 0.02 |
| Profit Growth | 1.84 |
| PEG Ratio | 1.98 |
| Pledged Percentage | 0 |
- The company is almost debt-free.
- ROCE is quite high which is great.
- The company is working at more than 75% operating margins.
- It is a fundamentally strong company where sales have grown 11 times, Net Profit has grown 15 times, Reserves have grown by 13 times and Fixed Assets have grown by 8 times in the past 11 years.
- The growth in the Sales, Profits, and Reserves have been consistent YOY.
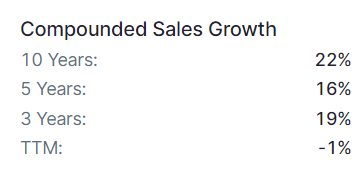
- CAGR Sales have been 22% and CAGR Profit has been 24% in the past 10 years.
- Cashflow has always been positive and in line with the Net Profits.
- The only down side for the company is its Share Holding Pattern. There are no Promoters. FIIs have reduced its holdings from 32 to 15%. DIIs have gone from 31 to 21%. Public holding has increased from 36 to 63%.
Calculating IEX Share Price Target
We have used certain formulas to calculate IEX Share Price Target.
We will use these formulas we will do calculations in the following order : –
- Future Sales
- Future Net Profits
- Market capitalization
- Share Price Target
Assumptions
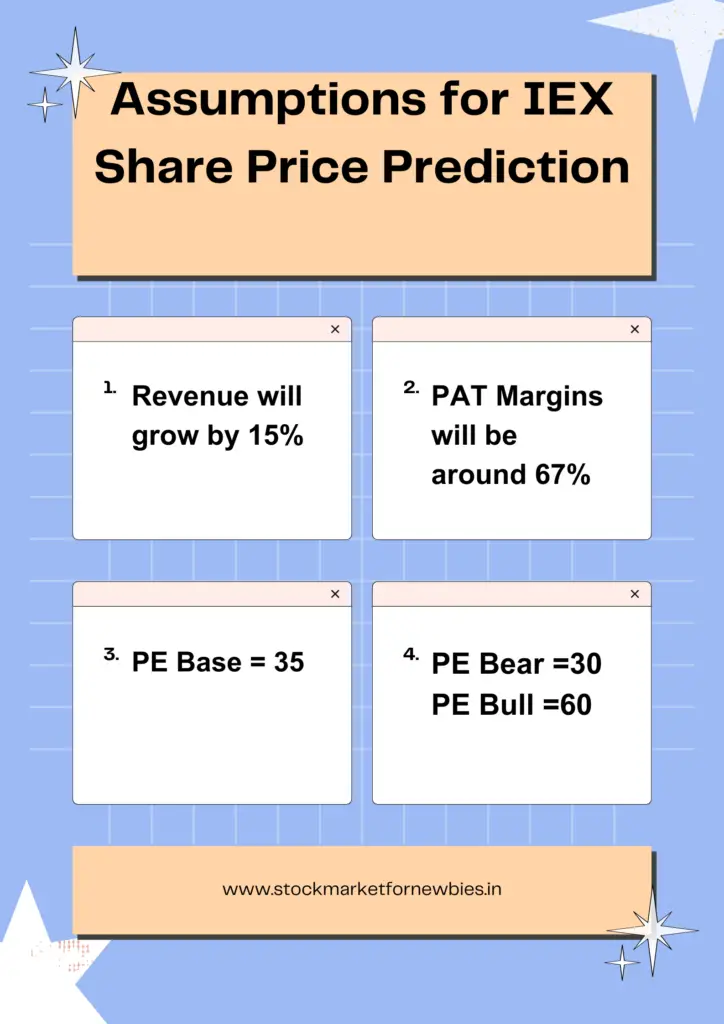
For these calculations we need certain assumptions.
- Sales Growth -IEX has shown CAGR Sales of 19% for the past 10 years. Being conservative let’s assume the sales will keep growing like this by 15% every year.
- PAT Margins -PAT Margins have increased from 57% to 72% in the last 5 years. Average PAT Margins have been 67% for that period. So let’s take the average for our calculations. PAT Margins = 67%.
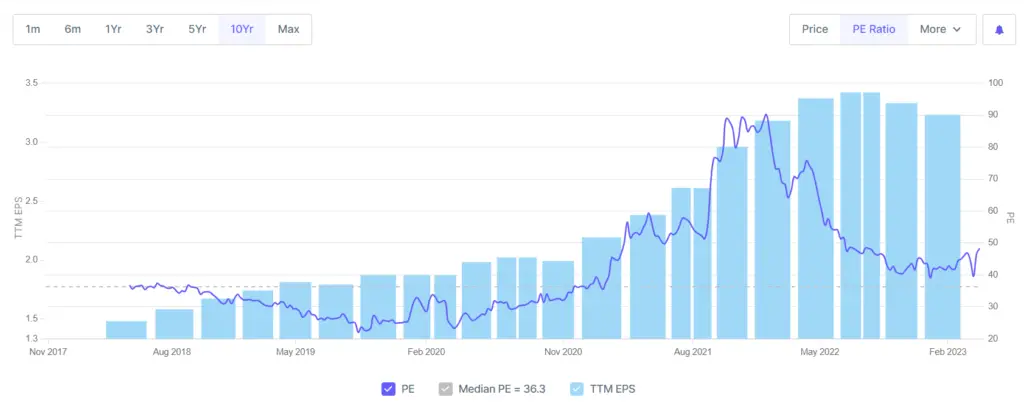
- PE – The market has given IEX PE of 22 to 90 with median PE being 36. PE measures the market sentiments for a stock.
Let’s take
PE in Base Case – 35 ;
PE in Bear Case- 30;
PE in Bull Case- 60.
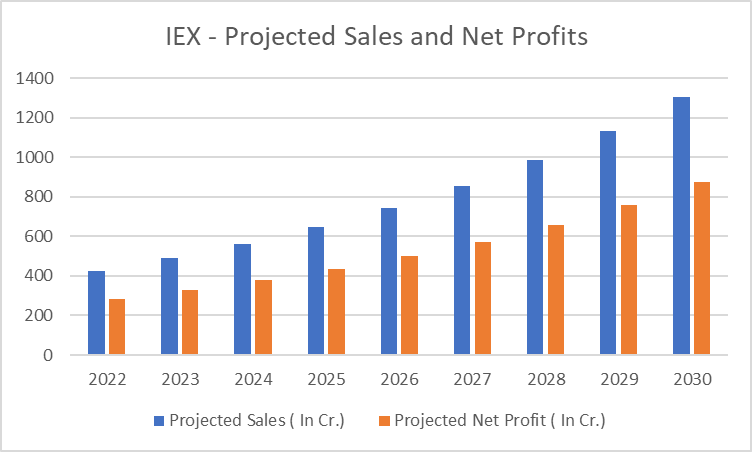
IEX Future Sales and Net Profit
- To calculate future sales we will multiply sales of last financial year with 1.15.
Projected Sales (Next Year)= Sales Current Year + X% of Sales Current Year, where X= Assumed Sales Growth.
Eg:- Projected Sales 2023 = Sales 2022 + 15 % Sales 2022.
- To Calculate Net Profit we will multiply sales of a given year with PAT Margins (0.67)
Projected Profit = Projected Sales X Profit After Tax Margin (in %)
| Year | Projected Sales ( In Cr.) | Projected Net Profit ( In Cr.) |
| 2022 | 426 | 285 |
| 2023 | 490 | 328 |
| 2024 | 563 | 377 |
| 2025 | 648 | 434 |
| 2026 | 745 | 499 |
| 2027 | 857 | 574 |
| 2028 | 985 | 660 |
| 2029 | 1133 | 759 |
| 2030 | 1303 | 873 |
- This table shows what Sales and Net Profits IEX can make in years to come according to our assumptions.
- If you change your assumptions for Sales Growth and PAT Margins, Projected sales and Net profits will be different.
- We will use this table for further calculations.
IEX Share Price Target Base Case
- If IEX kept growing like this and the market has neutral sentiments for this share, it will be base case.
- The market will in this case give it a median PE which is 35 in our case.
- We can calucualte MCap by multiplying 35 and Net Profit in that year.
Market Capitalization (Base Case) = Projected Profit X PE (Base case)
- Share price can be calculated by dividing MCap by number of shares in Cr. (89.2)
Share Price (Base Case) = Market Capitalization (Base Case) / No. of Shares
| Year | PE (base case) | Mcap ( Base Case) ( In Cr.) | Share price (Base Case) |
| 2022 | 35 | 9990 | 112 |
| 2023 | 35 | 11488 | 129 |
| 2024 | 35 | 13211 | 148 |
| 2025 | 35 | 15193 | 170 |
| 2026 | 35 | 17472 | 196 |
| 2027 | 35 | 20093 | 225 |
| 2028 | 35 | 23107 | 259 |
| 2029 | 35 | 26573 | 298 |
| 2030 | 35 | 30559 | 343 |
IEX Share Price Target Bear Case
- This scenario will follow when the company is doing same sales and Net Profits but there is some bad news regarding IEX in the market or some competitor comes into the market.
- In that case the market will give it a lower PE.
- According to the historical data we take PE in this case as 30.
- Formulas for MCap and Share Price remain same as above.
| Year | PE (Bear Case) | Mcap (Bear Case) ( In Cr.) | Share Price (Bear Case) |
| 2022 | 30 | 8563 | 96 |
| 2023 | 30 | 9847 | 110 |
| 2024 | 30 | 11324 | 127 |
| 2025 | 30 | 13023 | 146 |
| 2026 | 30 | 14976 | 168 |
| 2027 | 30 | 17222 | 193 |
| 2028 | 30 | 19806 | 222 |
| 2029 | 30 | 22777 | 255 |
| 2030 | 30 | 26193 | 294 |
IEX Share Price Target Bull Case
- This is the scenario when the company is posting same results but the market becomes bullish about this stock for some reason.
- Then the market starts giving higher PE to the share. In this case, we take PE as 60.
- Formulas for MCap and Share Price remain same as above.
| Year | PE (Bull Case) | Mcap (Bull Case) ( In Cr.) | Share Price (Bull Case) |
| 2022 | 60 | 17125 | 192 |
| 2023 | 60 | 19694 | 221 |
| 2024 | 60 | 22648 | 254 |
| 2025 | 60 | 26045 | 292 |
| 2026 | 60 | 29952 | 336 |
| 2027 | 60 | 34445 | 386 |
| 2028 | 60 | 39612 | 444 |
| 2029 | 60 | 45553 | 511 |
| 2030 | 60 | 52386 | 587 |
IEX Share Price Target 2023
| Year | Share Price (Bear Case) | Share price (Base Case) | Share Price (Bull Case) |
| 2023 | 110 | 129 | 221 |
- Currently share price of IEX has fallen 50% from its lifetime high.
- This is because the sales of IEX in the last two quarters have fallen and so have the profits.
- The reason for low sales is that IEX is a trading platform where the cost of electricity goes up and down depending on demand and supply.
- During the COVID lockdown period the demand was low and supplies high therefore the price of electricity fell down and sales of IEX increased dramatically.
- Post-COVID the demand surged again and the supply of electricity was low so the electricity prices shot up resulting in low sales 0f IEX.
- IEX has already taken support at levels of 125 and may rise from this point.
- Technically a rounding pattern is also forming which shows it is a good point to enter in IEX.
IEX Share Price Target 2024
| Year | Share Price (Bear Case) | Share price (Base Case) | Share Price (Bull Case) |
| 2024 | 127 | 148 | 254 |
- Indian economy is growing at a faster rate and so will be the demand of electricity.
- Electricity demand is expected to grow by a CAGR of 7% in FY 23-30.
- IEX transparent mechanism, high liquidity helps in low cost and assured delivery which keeps it above its competitors.
- Share Price will range from 127 to 254, so short term can use them as reference points to enter and exit during the year.
IEX Share Price Target 2025
| Year | Share Price (Bear Case) | Share price (Base Case) | Share Price (Bull Case) |
| 2025 | 146 | 170 | 292 |
- IEX is using customer centric technology and product strategy for ease of customer service. This makes it a preferred exchange over its competitors.
- IEX has a robust business model and financial strength.
- It has enteed into gas exchange as well to lead India’s gas based economy. IGX has shown an YOY growth of 568% which is bound to grow further.
- It has also launched GIXI- IGX gas index to represent average price of gases traded on any day.
- Share prices of IEX will vary from 146 to 292 in 2025 . Dips below these prices could be time to buy and share price going more than 292 could be a time for profit booking.
IEX Share Price Target 2030
| Year | Share Price (Bear Case) | Share price (Base Case) | Share Price (Bull Case) |
| 2030 | 294 | 343 | 587 |
- IEX has also started ICX- International Carbon exchange to buy, sell voluntary carbon credits.
- IEX has well diversified its portfolio to build next-generation sustainable solutions.
- Its new products will act as growth drivers for IEX.
- IEX is enjoying favorable policies and regulatory initiatives which will further deepen the power markets.
- Share Price of IEX could go as high as 587 so whenever this price is achieved investor can book profit and exit of the stock.
Conclusion
- IEX is a fundamentally strong company that has grown in sales and profits over years delivering high ROCE.
- Electricity is a highly regulated commodity that is a lot dependent on government policies and regulations.
- IEX helps small energy producers to find buyers in the fragmented market. These small electricity producers who are using solar panels on their rooftops, using windmills are growing in number.
- Government initiative to increase coal supply will further reduce prices of electricity and hence further lowering of prices at the exchange.
- Future opportunities like virtual PPAs, P2P Trading, Green Hydrogen and Battery Energy Storage Systems will further strengthen the business for IEX.
- Investors can use these share price targets as reference points for entry and exit.
- Share Price Targets of bear case could be used as entry points and that of bear case as exit points.
Read More:- IRCTC Share Price Target

Use the link to open a Demat account in Zerodha.
Disclaimer- All investments and trading in the stock market involve risk. Any decision to place a trade in the financial markets, including trading in stock should only be made after thorough research. Trading strategies or related information mentioned in the article is for informational purposes only. Use your due diligence before investing. These are just predictions. They may or may not be true. We are not SEBI-registered analysts.